
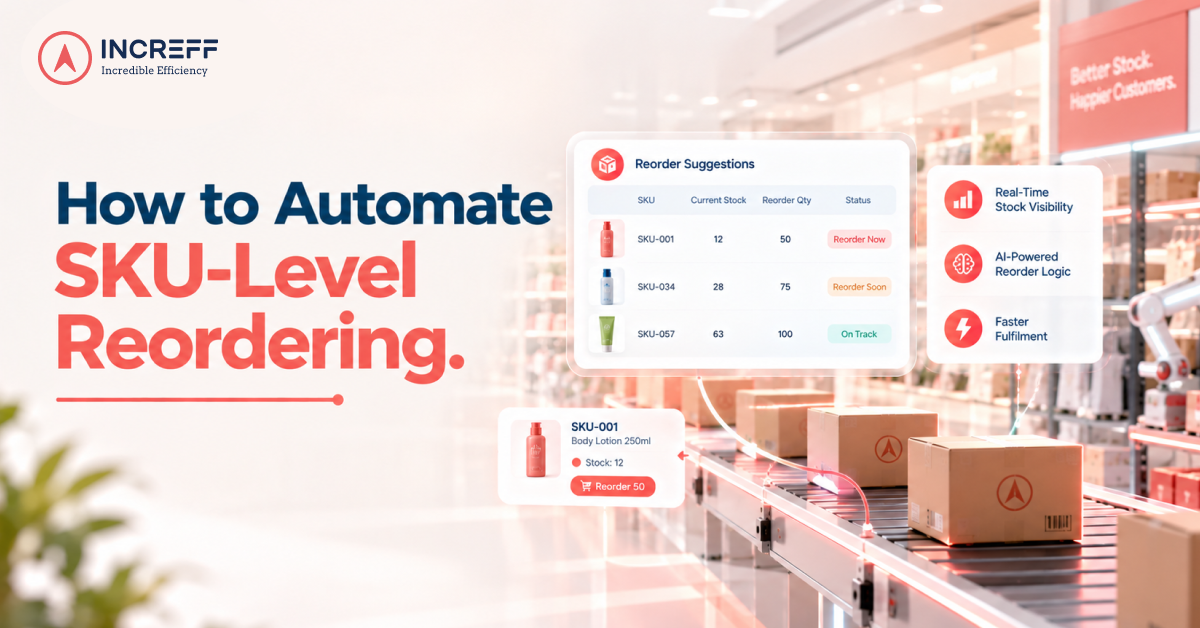


TL;DR
Automated reordering works when every SKU gets its own quantity, built from true demand, lead time, safety stock and cover days, instead of one static reorder point per category. Fix the demand signal first, set cover rules by product tier, then let the software draft orders while buyers review only the exceptions.
Stop Losing Bestseller Sales Today
A bestselling kurta sells out in size M on a Tuesday. The buyer finds out on Friday, the purchase order goes out the following Monday, and stock lands five weeks later, long after demand has moved on. At Increff, we see this pattern in fashion and footwear brands that still plan inventory in spreadsheets. Automated reordering closes that gap, but only when it works at the level where customers actually buy.
IHL Group's 2025 research puts out-of-stocks at $1.2 trillion and overstocks at $572 billion globally, together with about 6.5% of worldwide retail sales. Both are forms of inventory distortion, and both come from one decision made badly: how much to order, and when.
What is SKU-level reordering?
SKU-level reordering is the practice of tracking inventory and triggering replenishment purchase orders independently for each unique Stock Keeping Unit (SKU) based on its specific sales velocity, lead time, and safety stock.
The core logic is simple:
- Target stock = rate of sale (ROS) × target cover days
- Order quantity = target stock + safety stock, minus on-hand and in-transit stock, adjusted for lead time and MOQ
Why do reorder point rules fail for retailers?
A rule of the form "when stock falls to X, order Y" works for stable, always-on items. It breaks across fashion and lifestyle ranges for four reasons:
- Demand shifts with seasons, promotions and events, but the threshold stays fixed.
- Stock-outs and broken size runs depress sales, so the rule under-orders the very items that are selling.
- Lead times vary by supplier and by order, yet most rules use a single figure.
- One threshold per style ignores that the same item behaves differently in different stores.
How do you automate SKU-level reordering step by step?
- Choose what to automate first. Start with bestsellers and NOOS (never-out-of-stock) lines. Leave new launches and end-of-season styles with buyers.
- Build a true demand signal. Measure ROS only on days the SKU was actually available, and only when enough pivotal sizes were in stock. Layer in seasonality and revenue-target changes.
- Set cover days by tier. Fast sellers with long lead times need more days of cover than slow lines with short ones. Revisit as demand and supplier timelines move.
- Add safety stock, lead time and MOQ. Project closing inventory across the lead time (opening + inwards − sales), then order the gap to forecast demand for the cover period.
- Gate every order with a budget. Check each recommendation against open-to-buy (OTB) so replenishment stays inside the approved plan.
- Use automated approvals and manage by exception. Let the software raise automated purchase orders within tolerance. Buyers touch only the flagged ones, and the same automated rules keep running while they do.
- Measure and tune. Track top-seller availability, fill rate, forecast accuracy and full-price sell-through every month, then adjust cover rules.
What data does automated reordering software need?
Automated reordering software is only as good as its inputs. Before you evaluate vendors, confirm you can supply:
- Daily sales by SKU and store, with live-day and stock-out flags
- Current and in-transit inventory by node
- Supplier lead times, MOQs and pack sizes
- OTB budgets by category
- Style attributes (category, colour, size, price band) so new styles can borrow demand from similar ones
When you shortlist vendors for automated reordering, ask three questions.
- Can it forecast by store and size?
- Does it correct demand for stock-outs and broken size sets?
- Can it respect budgets and MOQs when it proposes quantities?
How Does Increff Automate Reordering for Retailers?
Most retail systems make one costly mistake: they treat zero sales on a stocked-out day as zero demand. Increff solves this by identifying how much a product would have sold if it had been available in the right sizes. It forecasts daily demand for every product at each store, accounting for stock availability, seasonal trends, and sales targets. For new products with no sales history, it estimates demand using similar products.
Based on this forecast, Increff automatically determines what to reorder, how much to order, and what not to reorder by considering current stock, expected sales, supplier delivery times, and the extra stock needed to avoid running out. It also prioritizes products based on sales performance and discount levels, ensuring retailers invest in products with stronger full-price demand. Every recommendation is checked against the buying budget, while inventory reports flag products that are running low or sitting in stock for too long.
With its AI-powered Decision Mesh, Increff uses 50+ specialized AI agents, supported by 15 agents that improve demand data overnight. The result? Across Increff merchandising deployments, brands report 14 percentage points higher sell-through and 25% lower stock holding.
Conclusion
Automated reordering pays off when three things line up: a demand signal corrected for stock-outs, quantities that respect lead time and cover, and buyers freed to handle exceptions. Start with bestsellers and NOOS lines, prove the gain on availability and full-price sell-through, then widen scope across the rest of your inventory.
Book a demo
Frequently asked questions
Q: What tools are best for handling peak loads like festive season without performance issues?
A: Peak season doesn’t create inventory problems, it exposes them, so the tools that hold up are the ones that fix execution gaps: allocation by store cluster and size curve, short replenishment decision cycles, and order routing that works from live sellable inventory. The page’s weekly KPI review (in-stock rate, weeks of supply, order split rate, cancellation rate) shows whether the setup is holding while there is still time to fix problems.
Q: Which inventory platforms are strong at handling flash-sale spikes without overselling?
A: Overselling happens when inventory counts lag behind sales, so a channel keeps selling stock that is already gone. Platforms that handle spikes well keep one live view of what is sellable, and the page says smart order routing works from live sellable inventory instead of stale counts. Without that view, retailers either oversell and cancel, or undersell and miss revenue.
Q: What inventory platforms can prevent overselling when multiple channels update simultaneously?
A: The page lists channel imbalance as a common peak failure: online demand drains store inventory, or the reverse. Preventing it means knowing what you have, where it is and what is sellable across every channel, and protecting store availability while serving digital demand. Routing from live sellable inventory instead of stale counts closes the gap that causes oversells.
Q: How does an OMS reduce order cancellations?
A: A strong order management system cuts cancellations by routing each order from live sellable inventory, so it does not promise stock that is already gone. It also fulfils from a single node whenever that is viable, routes on proximity, SLA and sellable inventory, and minimises split shipments and expedites. The page lists cancellation rate among the KPIs to review weekly.
Q: Can an OMS route orders through the nearest available warehouse?
A: Yes. Routing on proximity is one of the criteria the page lists for a strong OMS, alongside SLA and sellable inventory. Fulfilling from a single node whenever it is viable also limits split shipments, cross-zone fulfilment and expedites, which quietly inflate the fulfilment bill at peak volume.
Q: Which OMS routes orders based on fulfilment SLAs?
A: A strong OMS routes on SLA together with proximity and sellable inventory, so each order goes to the node that can meet the delivery promise without extra cost. Late deliveries add expedites, returns, support load and make-good discounts, which is why the page treats order routing as a margin decision rather than a logistics one. On-time delivery rate is one of the KPIs to track weekly.
Q: Which tools highlight which SKUs are likely to stock out before the next replenishment?
A: The page frames this as an execution problem. If a winner sells out Monday and the refill arrives next week, the moment is gone. Tools that help combine short decision cycles, clear reorder triggers and network-wide inventory visibility. Tracking in-stock rate on top styles, weeks of supply and replenishment lead time each week shows the problem while there is still time to fix it.
Q: What are the best tools for tracking and reducing lost sales due to stockouts?
A: Start with a short weekly KPI list: in-stock rate on top styles, full-price sell-through, weeks of supply and replenishment lead time. Then tie each number to a planning decision, such as reallocating by cluster, moving only sellable sizes and variants through inter-store transfers, or triggering replenishment before the window closes. The page notes that most peak failures are execution failures rather than demand failures.