


TL;DR
A size curve defines how units of a style should be distributed across sizes. When it is wrong, stores end up with size-outs on bestsellers and dead stock on fringe sizes.Generic, chain-level curves ignore local demand. Store-level size curves and demand-led prepacks are what protect sell-through and margin.This guide compares five size curve optimization software tools: Increff, Nextail, Blue Yonder, Oracle, O9 Solutions. If you need size decisions connected directly to in-season allocation and replenishment, Increff is the strongest fit.
Give every store its ideal size mix
IHL Group estimates that out-of-stocks cost retailers close to $1 trillion in lost sales annually, and in apparel a large share of those stockouts are really size-outs: the store has the style, just not the size. Meanwhile other research has repeatedly found that roughly 40% of fashion inventory sells at a markdown, a symptom of buying and allocating the wrong size mix in the first place. At Increff, we have helped fashion, footwear, and lifestyle brands across hundreds of stores replace chain-average size ratios with demand-led curves.
What is a size curve and why does it vary by store?
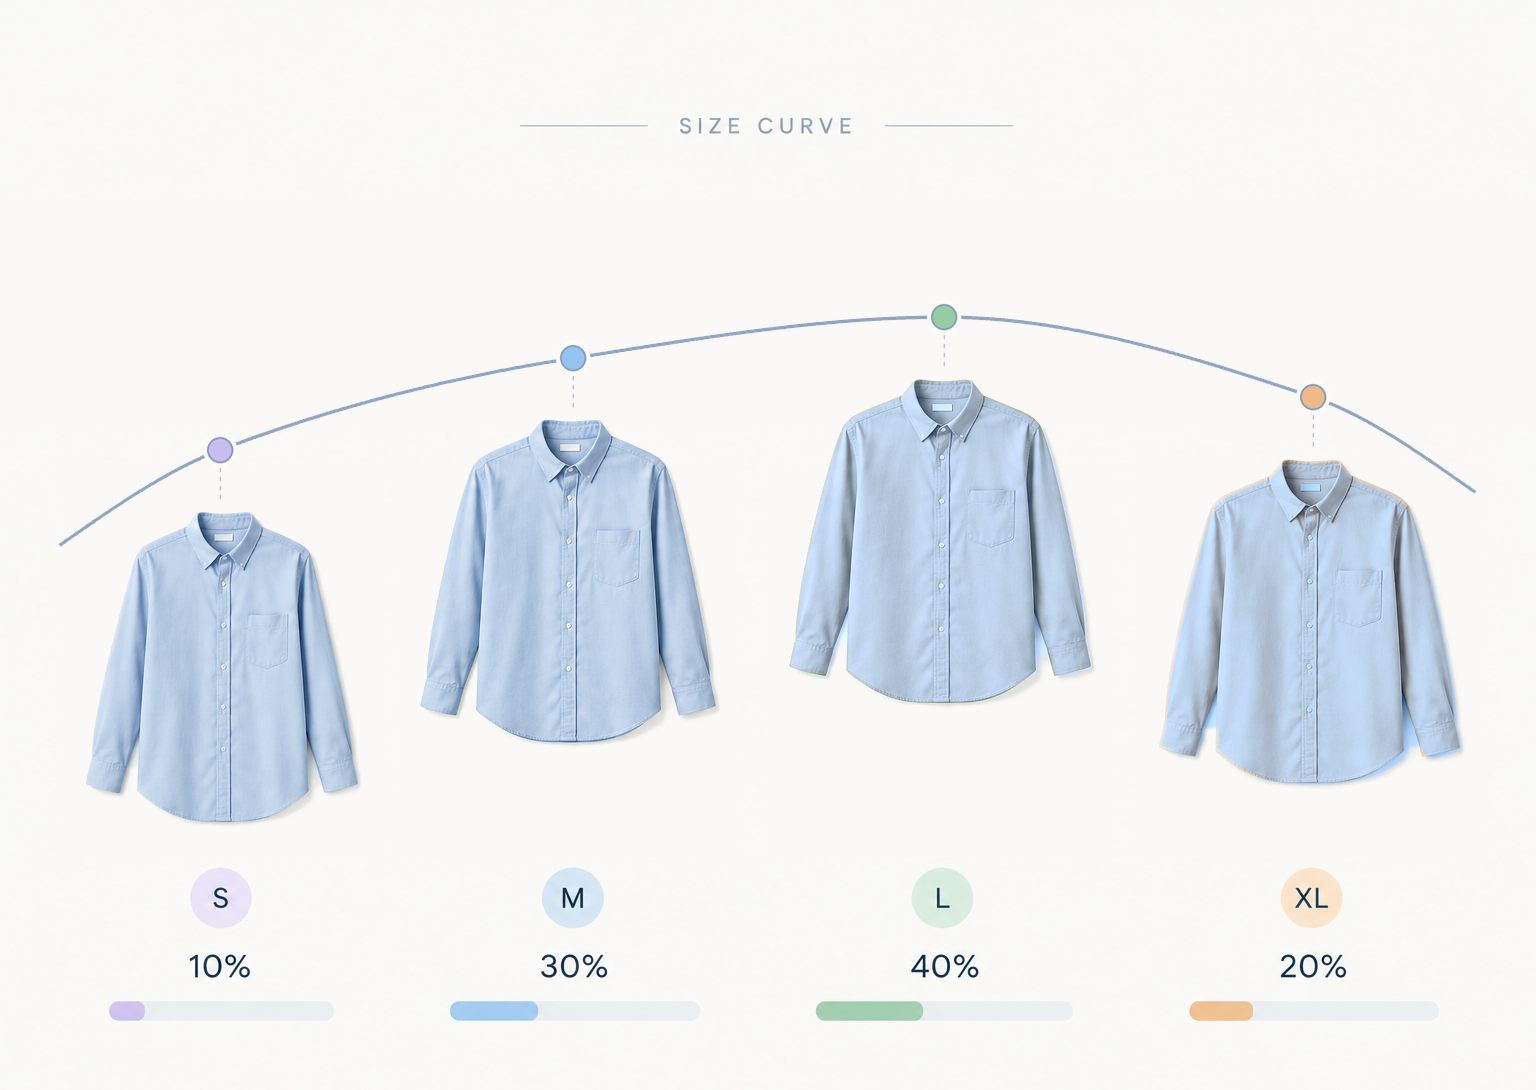
A size curve is the share of units you expect to sell in each size of a style. A shirt might split roughly 10% S, 30% M, 40% L and 20% XL (illustrative numbers). Store-level size curves differ because fit preferences, climate, age and format differ by location.
The problem: most retailers still buy and allocate on a single chain-wide curve, even though demand varies sharply by location. Size curve analysis fixes this. The software looks at actual sales by size and store, corrects for the days a size was out of stock (otherwise a sold-out size reads as zero demand), and builds store-level size curves for each category or attribute group. Retailers that move from one generic curve to store-level size curves typically see:
- Fewer size-outs on fast-moving sizes
- Lower terminal stock in fringe sizes, which means fewer markdowns
- Better prepack and size-pack decisions before purchase orders are placed
Essential Features to Look for in Size Curve Optimization Software
Before selecting a platform, retailers should evaluate how effectively it estimates size-level demand and translates those insights into practical buying, allocation, and replenishment decisions.
1. Store-Level and Category-Specific Size Recommendations
The software should recommend size distributions for individual stores or groups of stores with similar size-demand patterns, rather than relying exclusively on a company-wide average.
Recommendations should also account for relevant product categories and size ranges. A store’s ideal size mix for footwear, for example, may differ from its size mix for apparel.
2. Stockout-Aware Demand Analysis
The system should analyze historical sales alongside inventory availability to understand size-level demand.
If a size was out of stock for several days, its recorded sales may underestimate actual demand. The software should account for these availability gaps rather than treating low sales as evidence of low demand.
3. Actionable Size-Level Allocation
Size curve recommendations should translate into practical quantities by style, color, size, and store, either within the platform or through integration with allocation systems.
For example, if an allocation plan assigns 100 units of a particular style-color combination to a store, the software should help convert the recommended size percentages into whole-number quantities across the available sizes.
4. Pack and Supplier Constraint Support
Fashion retailers often purchase or distribute products in predefined size ratios or packs.
The platform or its connected planning and allocation tools should account for pack configurations, minimum order quantities, supplier restrictions, and available inventory when converting size recommendations into executable plans. Retailers should be able to distinguish the ideal demand-based size mix from the feasible buying or allocation mix.
5. Periodic Size Curve Updates and Replenishment Integration
Size-demand patterns can change during a season. The software should support reassessing size curves as sufficient new sales and inventory data become available.
Approved updates should feed into replenishment decisions, either directly or through connected systems. Retailers should also be able to control how frequently curves are reviewed to avoid reacting to short-term sales fluctuations.
6. Support for Sparse Data and New Products
Individual stores and new products may not have enough sales history to support reliable size recommendations.
The software should explain how it handles these situations for example, by drawing on comparable products, broader product categories, or stores with similar demand patterns. It should also flag recommendations based on limited data so planners know when additional review is needed.
7. Clear Performance Reporting
Retailers should be able to track the performance of size recommendations using metrics such as:
- Size-level stockout rate.
- Size availability by store.
- Full-price sell-through.
- Estimated lost sales.
- Inventory turnover.
- Markdown rate.
- Size-mix accuracy, or size-level forecast accuracy where forecasting is included.
Reporting should help retailers compare results across comparable periods, products, or store groups. Because pricing, promotions, assortment changes, and overall inventory levels also affect performance, improvements should not automatically be attributed to size curve optimization alone.
Which are the 5 best size curve optimization software tools?
1. Increff
Increff builds a store profile from historical sales, seasonality and attribute preferences, then applies demand-corrected size curves adjusted for past overbuying and underbuying. Its True ROS™ corrects for stockouts and discount spikes. Planners can override key sizes, which matters when fringe sizes sit between core sizes. Localized range plans set width, depth and size curves by store tier, cluster or channel. Celio used it to plan fresh allocation across 600+ points of sale.
2. Nextail
Nextail calculates size curves weekly at store and section-family-size-set level, using the last 60 days of sales by default. If a store sold fewer than 40 units for a family and size set, it falls back to all-store data, then to a full year, so thin data does not distort the curve. Its focus on fashion means it suits less well if your catalog spans many non-fashion categories.
3. Blue Yonder
Blue Yonder's Size Scaling optimizes the size curve by store or cluster. It mines sell-through, returns and substitution patterns, then translates curves into buy, allocation and replenishment quantities while accounting for vendor prepacks, minimums and omnichannel reservations. It also rebalances the mix in season to protect popular sizes.
4. Oracle
Oracle's SPO generates size profiles per location and at higher levels, using escalation logic to resolve the profile for each style and store. It flags and prunes profiles with irregular "kinks," routes them through exception-based approval, and supports prepack creation. Oracle Retail Allocation can import the resulting profiles, which makes this a solid size pack optimization software option inside the Oracle stack.
5. o9 Solutions
o9's size profiler rectifies historical sales for stockouts, creates multiple profiles before approval, and applies them over time so replenishment follows optimized size ranges through the season. It also tailors prepacks to store clusters and recommends re-leveling profiles after each season.
How does Increff turn store-level size curves into allocation?
A size curve only helps if it changes what ships to each store. Increff Merchandising Software builds the curve and runs allocation and replenishment from the same logic.
With store-level sales history and live rate of sale, retailers can:
- Build size curves from real demand: Use store DNA and True ROS™ to correct for stockouts and discount spikes, so broken sizes and cut-size scenarios stop repeating.
- Send stock where it sells first: Store-StyleRank™ ranks stores for each style by sales velocity, assortment fit and planogram gap.
- Allocate within real constraints: Respect pack sizes, MOQs, store grading and capacity, with manual key-size overrides for fringe sizes.
- Replenish and rebalance: Replenish to a target days of inventory cover, replace exhausted bestsellers with attribute-matched styles, and move stranded sizes through inter-store transfers.
By linking size curves to execution, Increff helps teams move from planning ratios to getting the right size into the right store.
Conclusion
Store-level size curves turn the same inventory into more sales by putting the right sizes in the right stores. Every size curve optimization software tool here can build them. The difference is how reliably the curve survives contact with real allocation. If you want curves, allocation and replenishment in one loop, start with one category and measure.
Frequently asked questions
Q: Which merchandise planning software helps improve full-price sell-through?
A: Full-price sell-through improves when the right sizes reach the right stores before a style needs to be marked down, which is what store-level size curves are built to do. Software that corrects historical sales for stockout days and discount spikes, rather than reading a sold-out size as zero demand, catches the actual size mix customers want and reduces the terminal stock in fringe sizes that typically ends up in a markdown.
Q: What software helps track size curves and reduce broken size sets in apparel stores?A: Tracking size curves starts with correcting sales data for the days a size was out of stock, since a sold-out size otherwise reads as zero demand and distorts the curve. Software that rebuilds store-level curves from that corrected data, then feeds them into replenishment, reduces broken size sets by keeping bestselling sizes in stock and fringe sizes from piling up as terminal stock.
Q: Which software calculates optimal size curves by store?
A: Store-level size curves account for the fact that fit preferences, climate, and format vary by location, so a single chain-wide curve misallocates sizes almost everywhere. Software that builds a store profile from historical sales and corrects it for stockout days produces a curve specific to that store’s actual size demand, rather than an average that fits no single location well.
Q: Which systems help retailers plan assortments store-wise based on local demand patterns?
A: Store-level demand varies because fit preferences, climate, age, and format differ by location, so planning by a single chain-wide average misses what each store actually needs. Systems built for this recommend size and assortment distributions for individual stores or groups of stores with similar demand patterns, rather than applying one company-wide curve everywhere.
Q: What are the top AI-based demand forecasting tools for fashion and lifestyle brands?A: Size curve accuracy depends on correcting historical sales for the days a size was out of stock, otherwise a sold-out size reads as zero demand and understates real interest. Demand forecasting tools built for fashion apply this kind of stockout correction before projecting what will sell, which is what keeps size-level recommendations grounded in actual customer demand rather than availability noise.
Q: Does AI improve retail demand forecasting accuracy?
A: Yes, specifically by correcting for the gaps that distort raw sales data, like stockouts and discount-driven spikes, before building a forecast. For size curves this matters directly: a size that sold out quickly looks like weak demand unless the system corrects for the days it was unavailable, so accuracy at the size level depends on this correction happening before any curve gets built.
Q: Which software recommends profitable inter-store stock transfers?
A: Size curves only help if the right sizes stay in stock through the season, and sometimes a size ends up stranded at the wrong store despite accurate planning. Software that recommends inter-store transfers for exactly this situation moves stranded sizes to locations where they’re more likely to sell, protecting sell-through after the initial allocation has already gone out.